Monitoring Transeptor with InfluxDB and Grafana
Transeptor can be configured to store metrics using a push(InfluxDB) metrics system. Grafana visualizes all the metrics.
Prerequisites
To set up monitoring for Transeptor, you will need the following installed on your local machine:
- Running Transeptor node see Get Started
- InfluxDB(docker image) -
influxdb:2.7.1
Setting up InfluxDB Docker
By default, InfluxDB is reachable at localhost:8086. We can use docker to run InfluxDB in a container.
- Start up InfluxDB in a docker container.
docker run -d --name influxdb -p 8086:8086 influxdb:2.7.1 --reporting-disabled
Set up InfluxDB to store metrics
Once InfluxDB runs, we can create a database for our metrics by opening a shell in the InfluxDB container. By default, InfluxDB can be reached at http:localhost:8086. We will use the CLI to set up InfluxDB, an initial admin user, operator token, and bucket.
To use the influx command line interface, open a shell in the influxdb Docker container:
docker exec -it influxdb /bin/bash
The following example command configures InfluxDB in non-interactive mode with an initial admin user, operator token, and bucket. For local development, we use the default user credentials below:
- username 'admin'
- password 'adminpwd'
- token 'ADMIN_TOKEN'
- org 'transeptor-labs'
- bucket 'transeptor_metrics'
influx setup \
 --username 'admin' \
  --password 'adminpwd' \
 --token 'ADMIN_TOKEN' \
  --org 'transeptor-labs' \
 --bucket 'transeptor_metrics' \
  --force
Now that we are all set up with the initial admin user, let's create a user for the Transeptor node. For local development, we use the default user credentials below:
- username 'transeptor'
- password 'mydevpwd'
influx user create -n transeptor -p mydevpwd
Verify created entries with:
influx user list
Get the bucket ID for the bucket we created earlier for transeptor_metrics:
influx bucket list
Use the bucket ID to create a read token for the bucket with:
influx auth create \
 --org transeptor-labs \
  --read-bucket <your_bucket_id> \
 --write-bucket <your_bucket_id> \
  --user transeptor
Copy the token value and save it for later use. The token value is used to configure a data source in Grafana and is used in the .env file for the TRANSEPTOR_INFLUX_TOKEN value.
Leave InfluxDB shell.
exit
InfluxDB is now running and configured to store metrics for Transeptor.
Setting up Grafana Docker
By default, Grafana is reachable at http://localhost:3000. We can use docker to run Grafana in a container.
- Create a new directory to store your metrics data.
mkdir $PWD/grafana-data
- Use docker to run Grafana in a container.
docker run -d --name grafana -p 3000:3000 grafana/grafana-enterprise
Grafana can now be reached at http://localhost:3000
- User your browser to navigate
http://localhost:3000to access a visualization dashboard. - On the sign-in page, enter admin for your username and password(username=
adminpassword=admin). - Make sure to update the admin password when prompted.
Adding Data sources
To visualize metrics with InfluxDB and Prometheus, we must add a data source to Grafana. Follow these steps to add a data source to Grafana.
InfluxDB
Grafana supports two query languages for InfluxDB: InfluxQL and Flux. InfluxQL is the default query language for InfluxDB 1.x. Flux is the default query language for InfluxDB 2.0. We will add two data sources for InfluxDB, one for each query language.
InfluxQL
- Navigate to
http://localhost:3000and click onAdd your first data source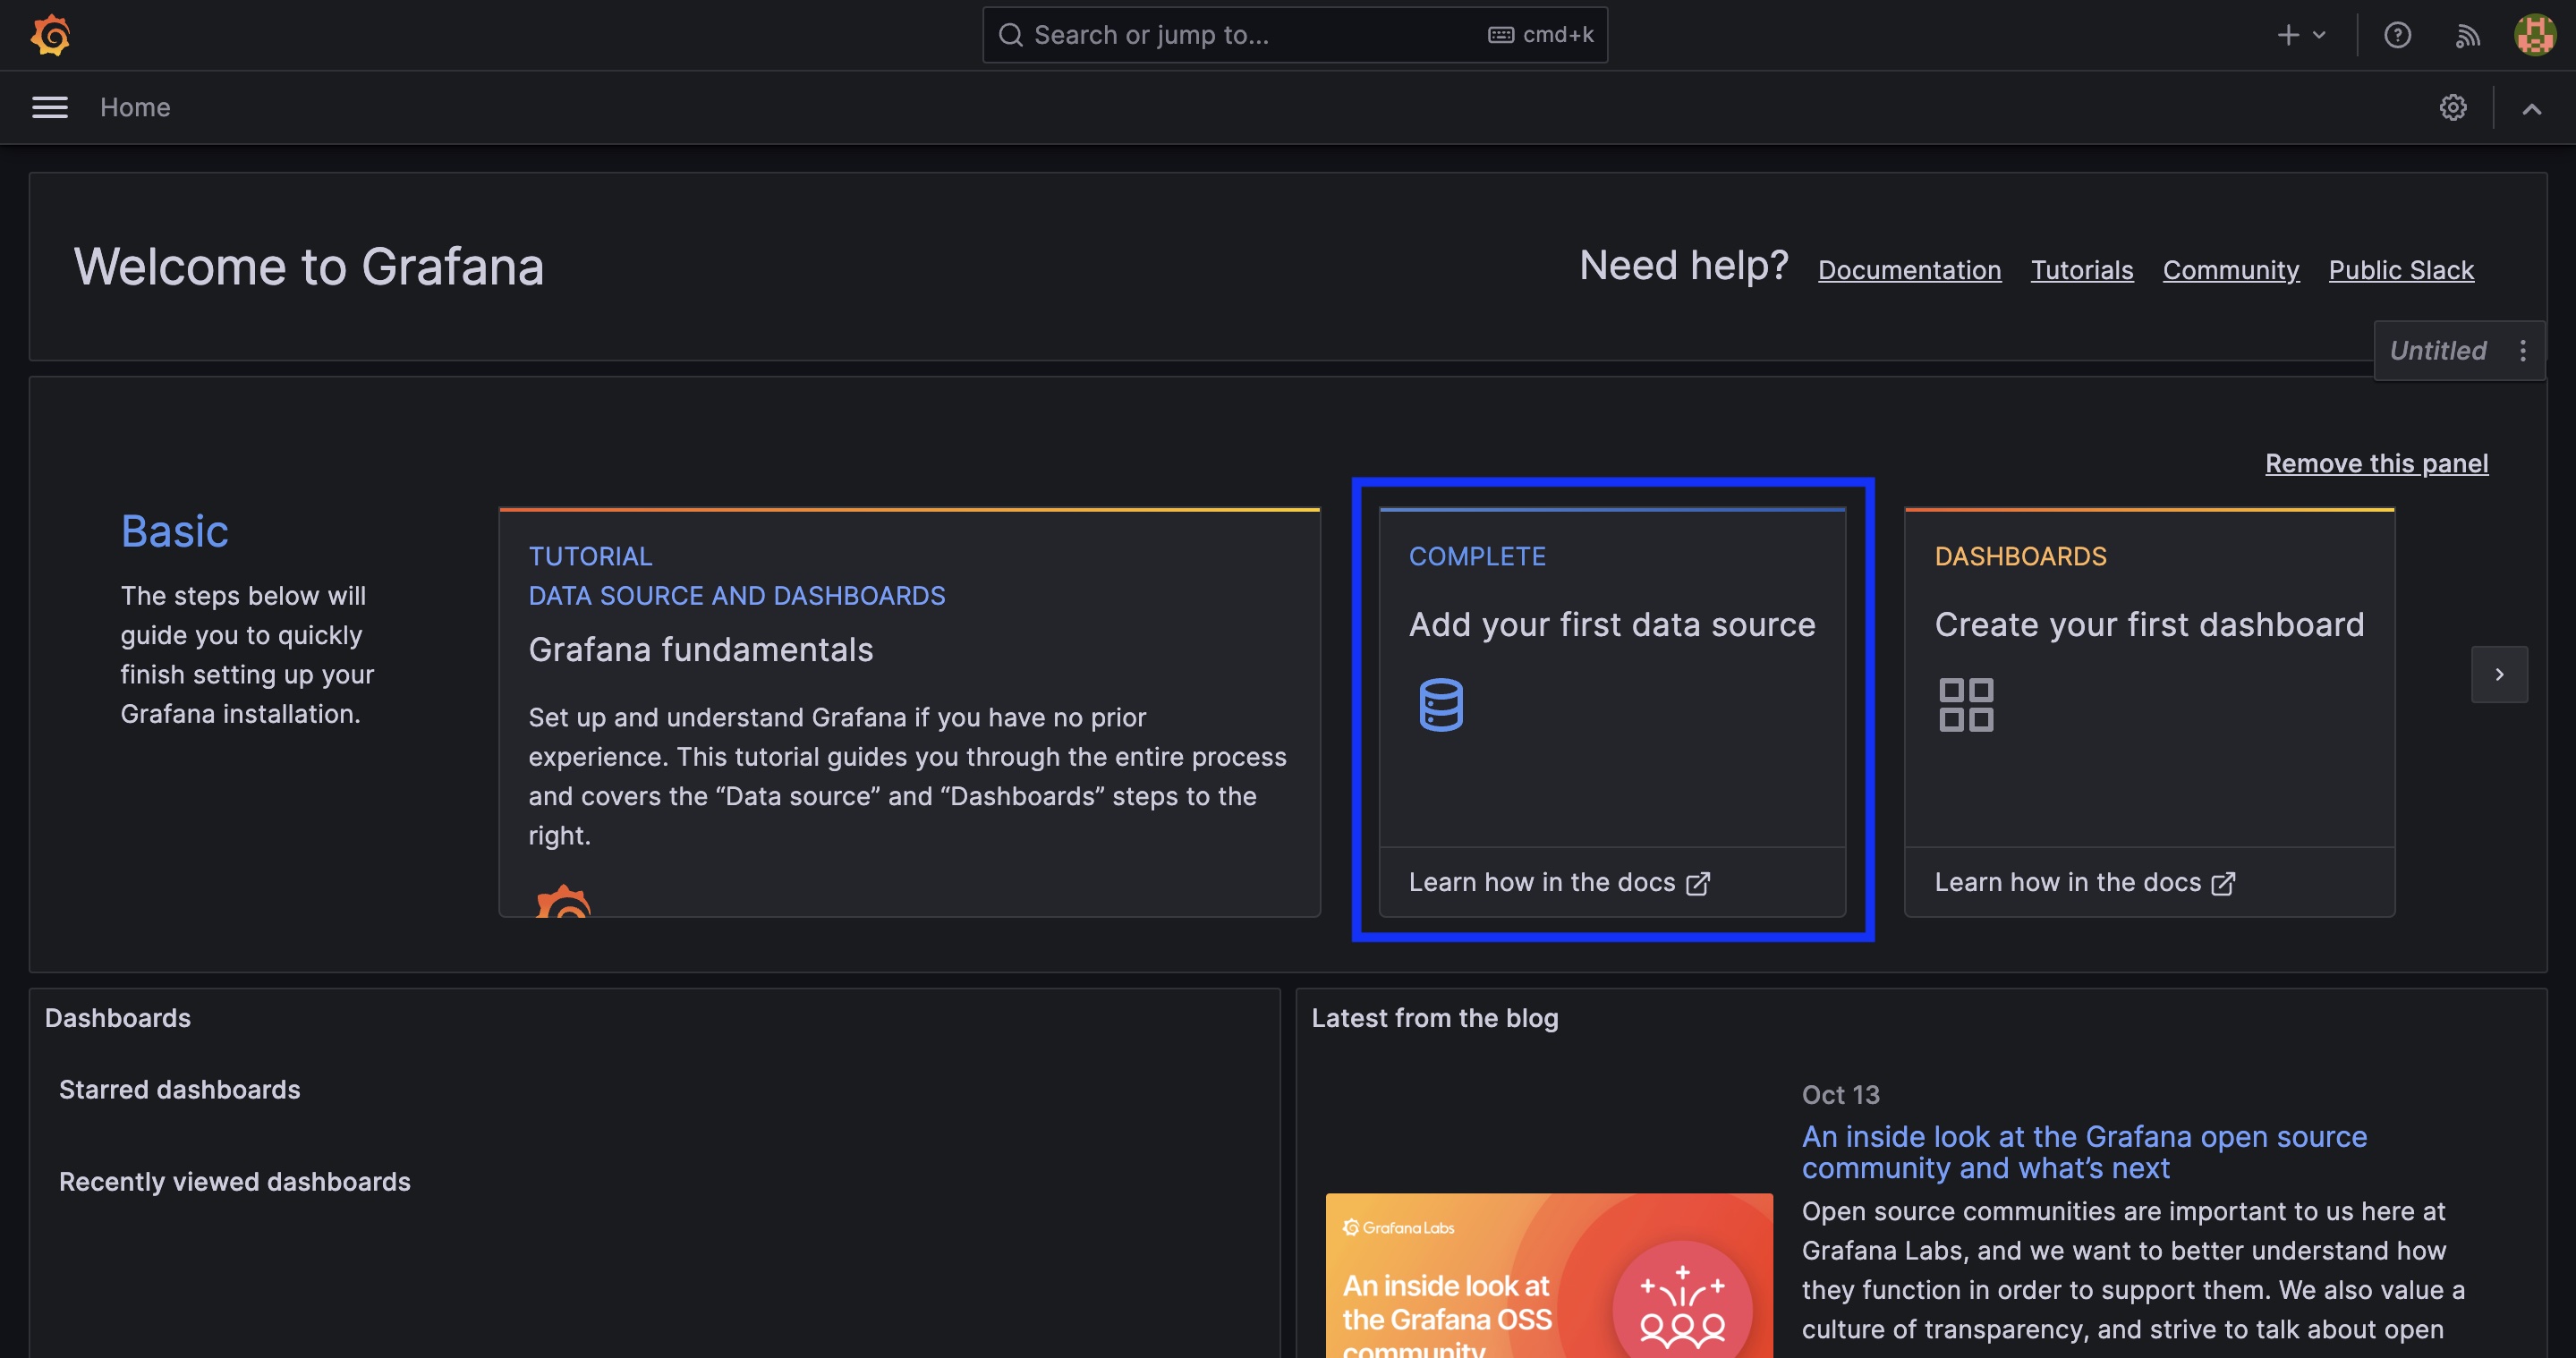
- Select
InfluxDBas the data source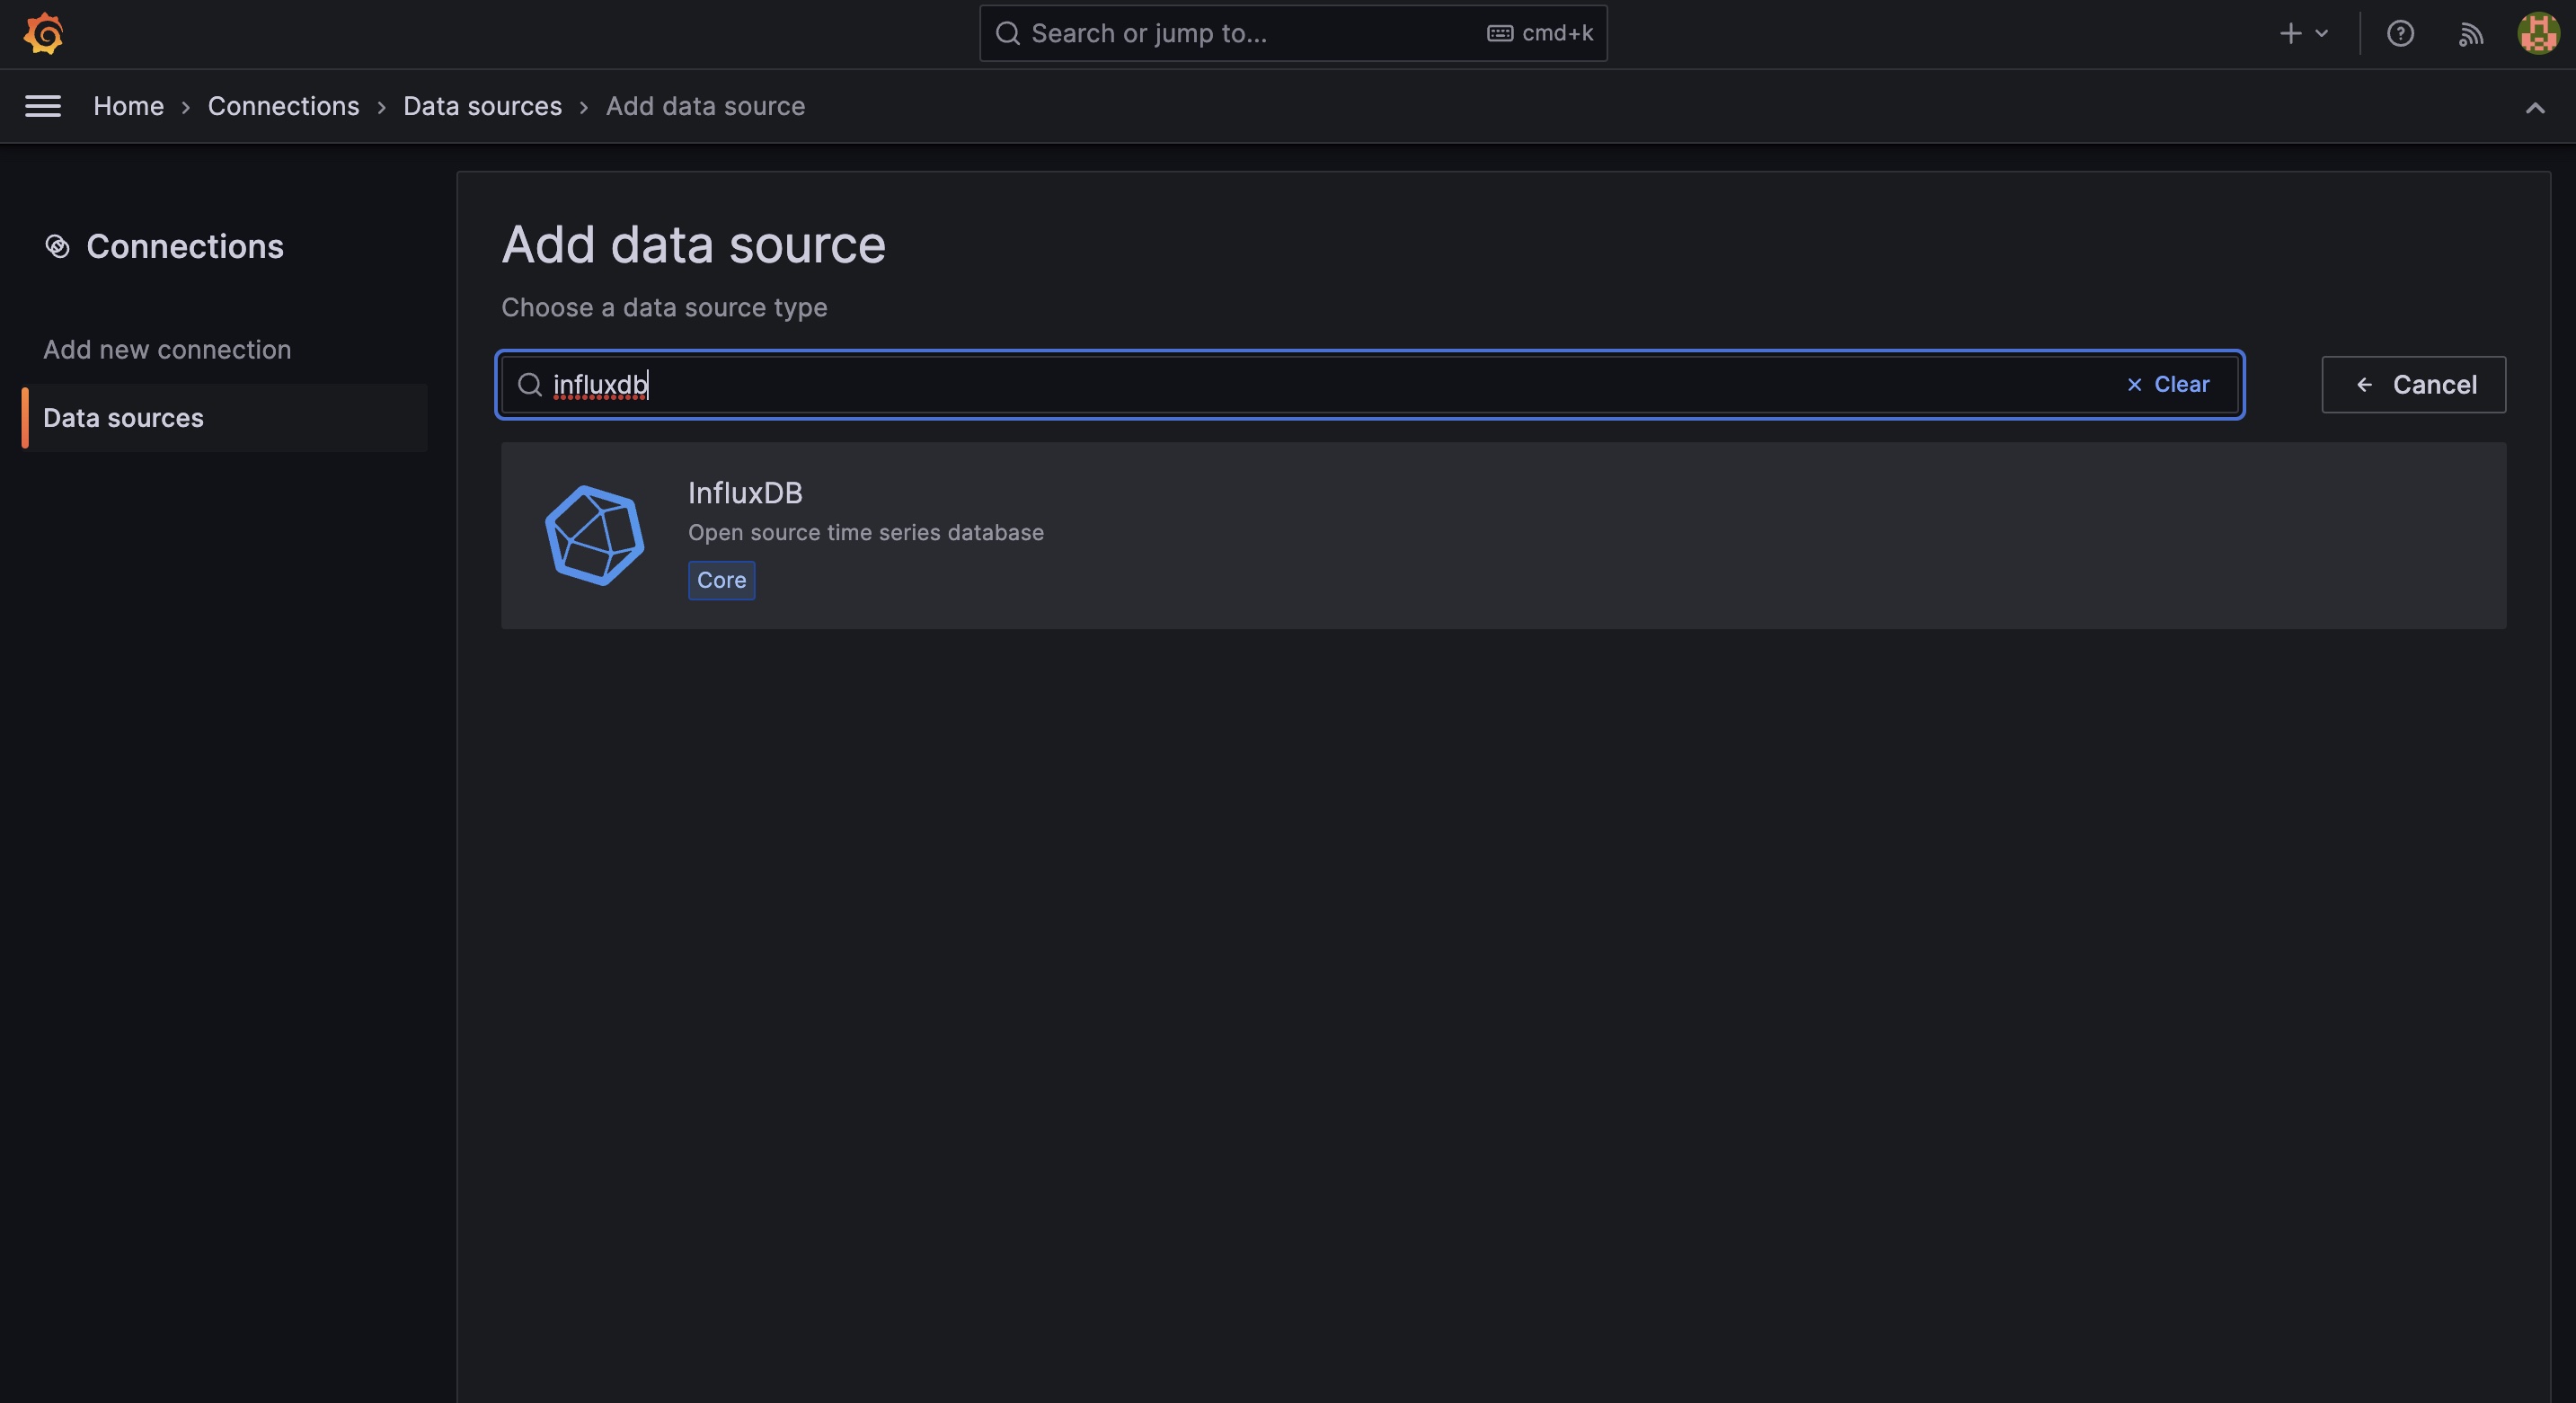
- Configure the data source with the following values:
- Name:
InfluxDB-InfluxQL - Query Language:
InfluxQL - URL:
http://host.docker.internal:8086 - Auth: toggle on
Basic Auth - Basic Auth Details: add a username and password for InfluxDB admin user(username=
adminpassword=adminpwd) - Custom HTTP Headers: Header=
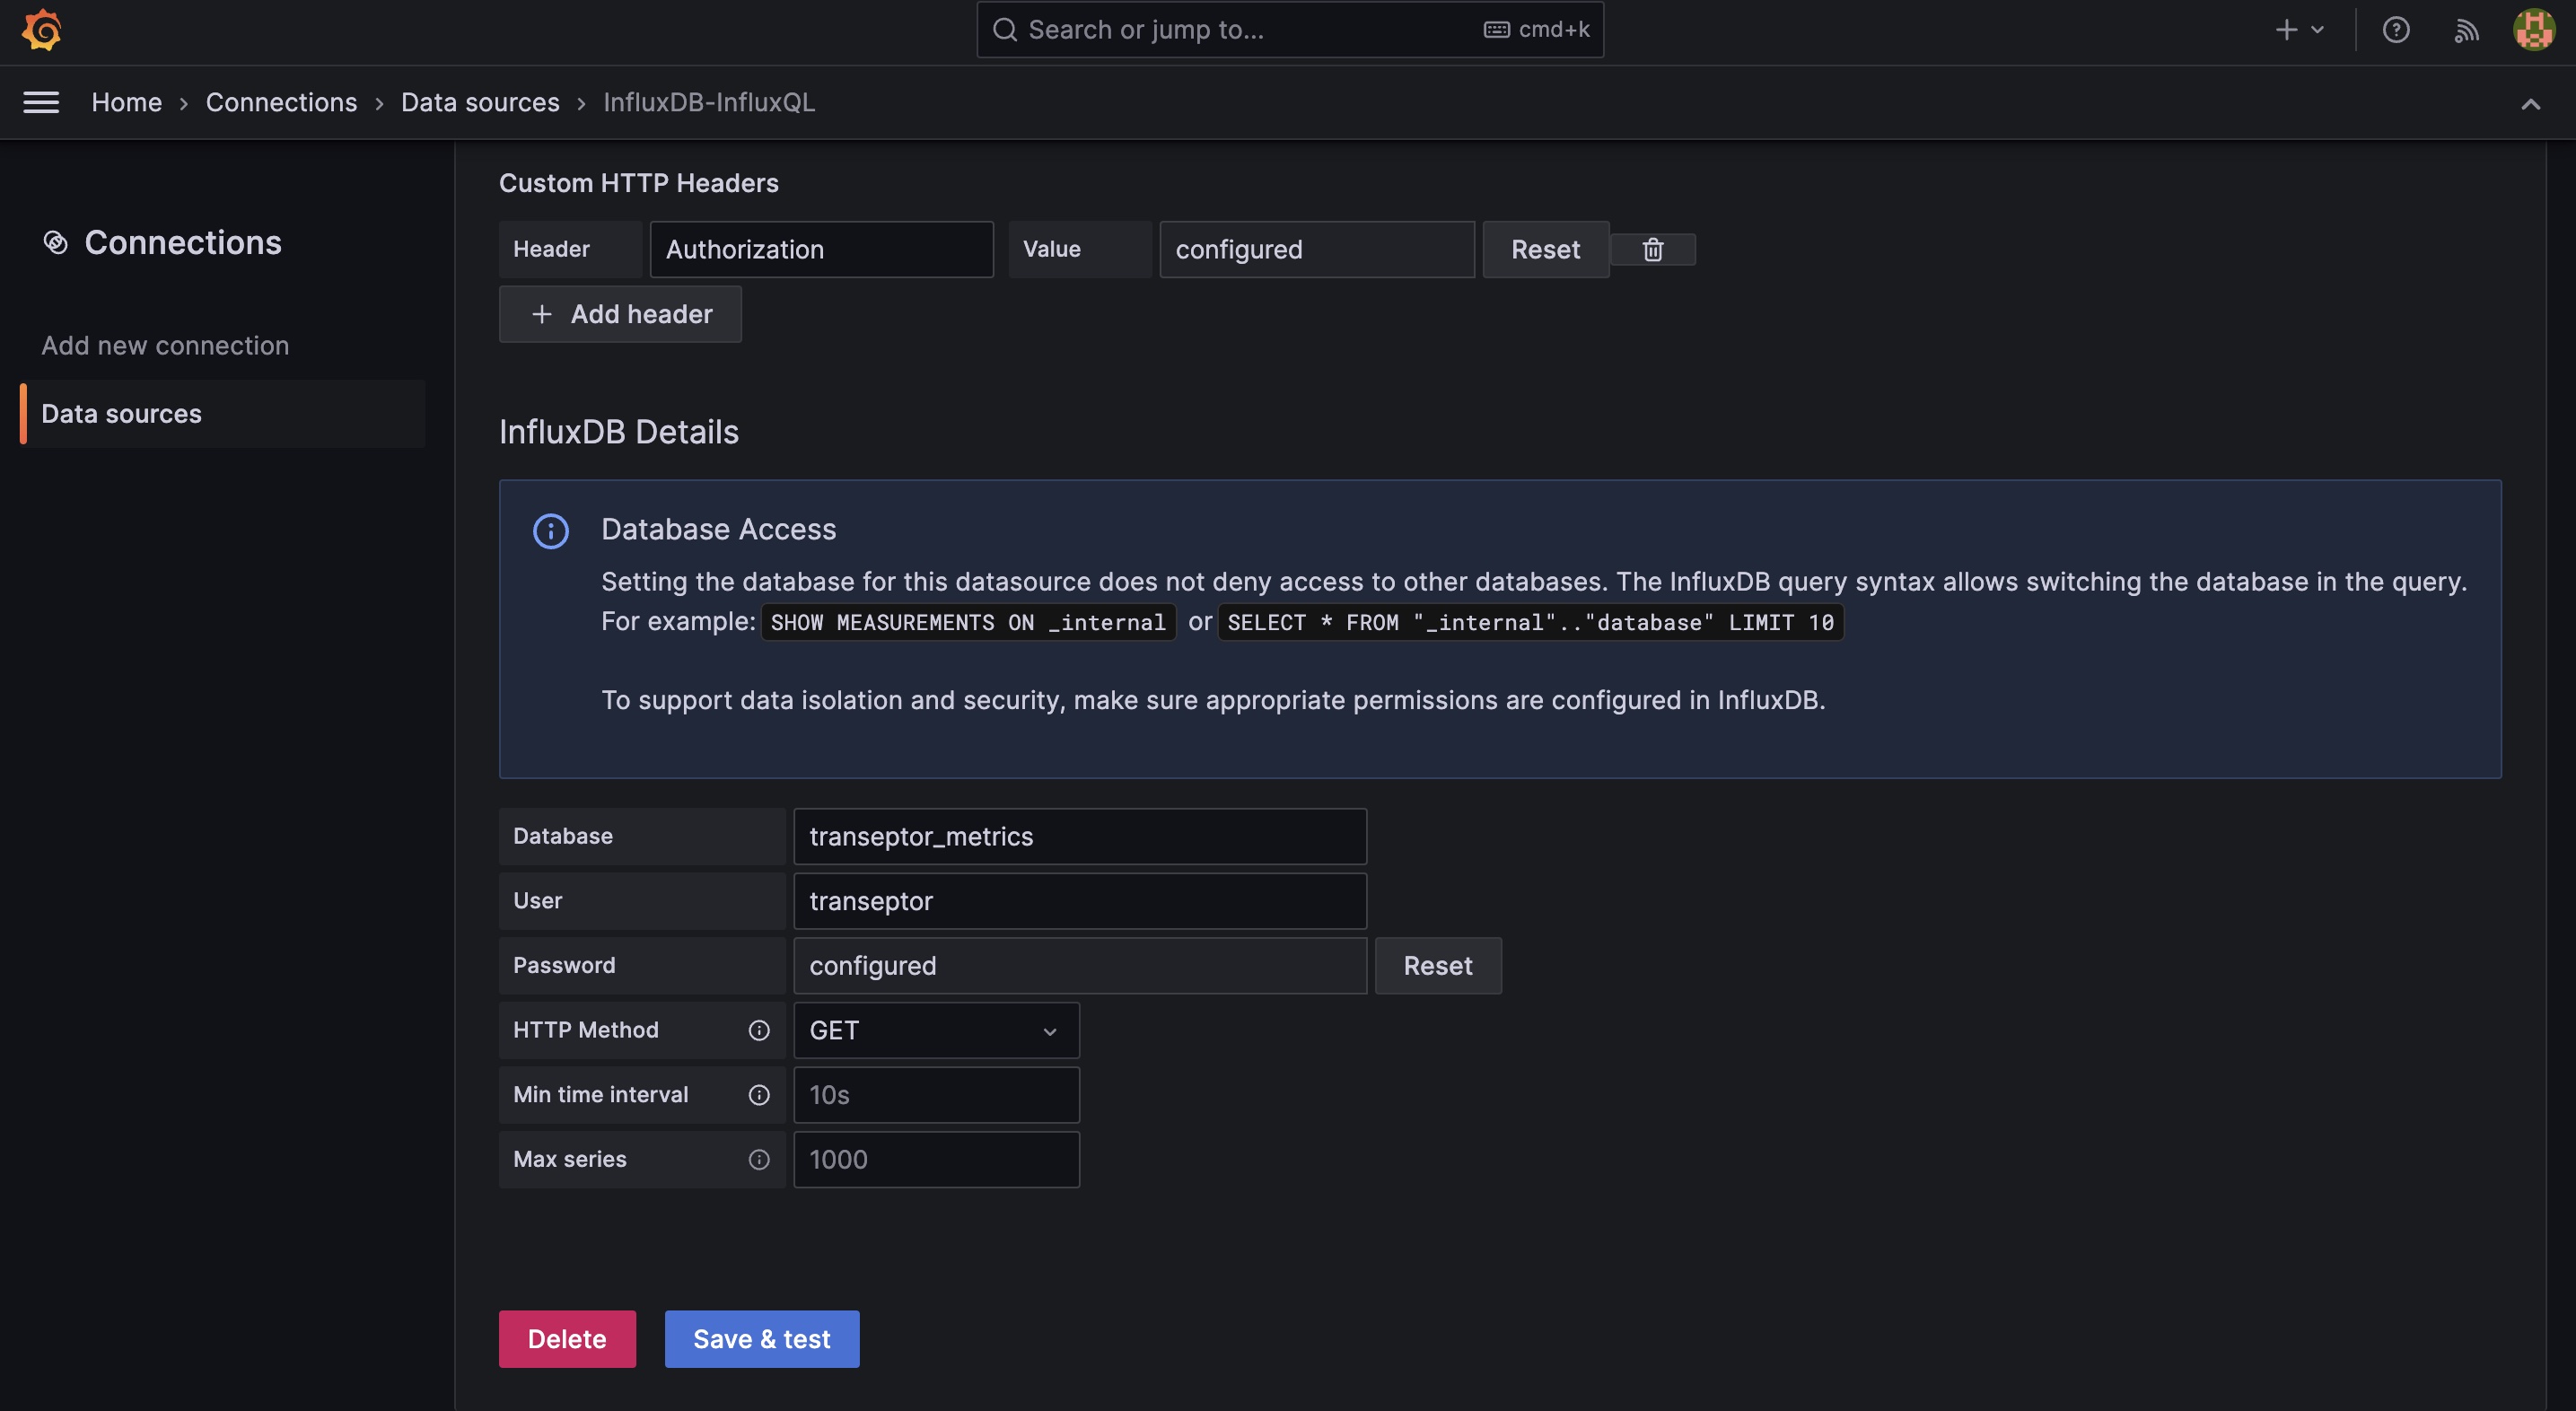
AuthorizationValue=Token <ADMIN_TOKEN> - InfluxDB Details: Database=
transeptor_metrics, User=transeptor, Password=mydevpwd, HTTP Method=GET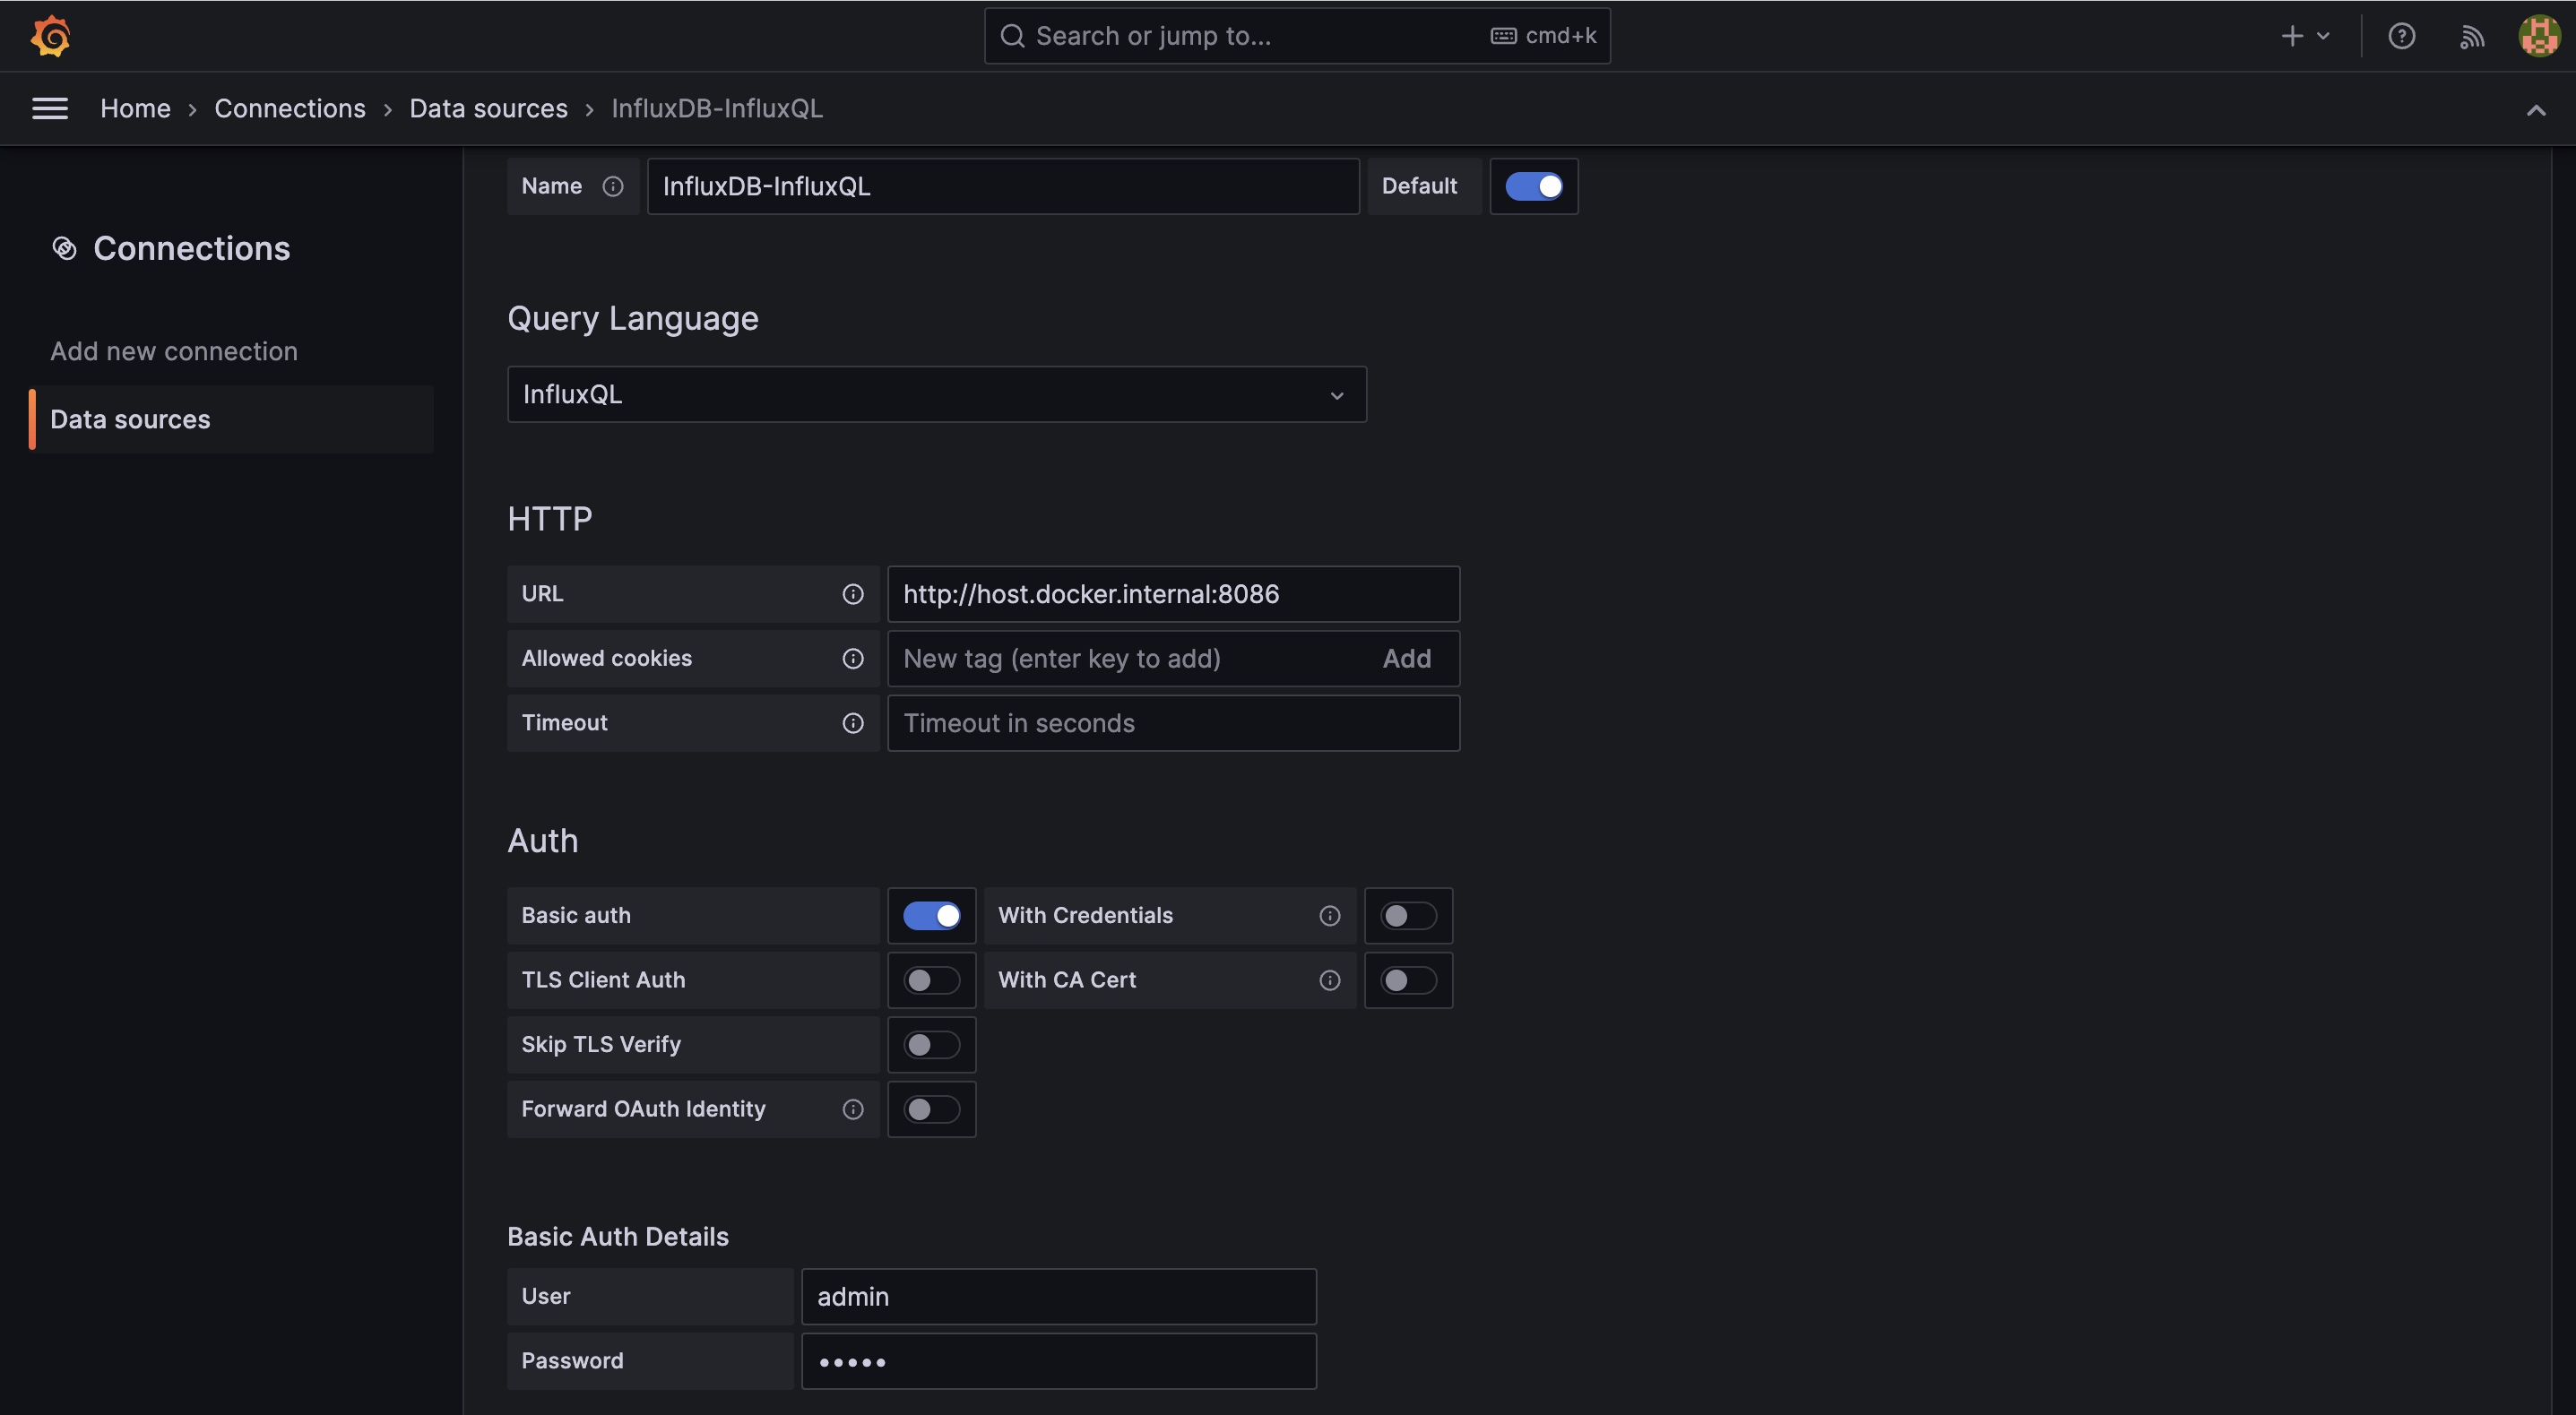
- Click
Save & Testto save the data source and test the connection.
If the connection succeeds, you should see a green Data source is working message.
Flux
- Navigate to
http://localhost:3000and click onAdd your first data source
- Select
InfluxDBas the data source
- Configure the data source with the following values:
- Name:
InfluxDB-Flux - Query Language:
Flux - URL:
http://host.docker.internal:8086 - Auth: toggle on
Basic Auth - Basic Auth Details: add a username and password for InfluxDB transeptor user(username=
transeptorpassword=mydevpwd) - InfluxDB Details: Organization=
transeptor-labs, Token=<YOUR_TOKEN_FOR_TRANSEPTOR_USER>, Default Bucket=transeptor_metrics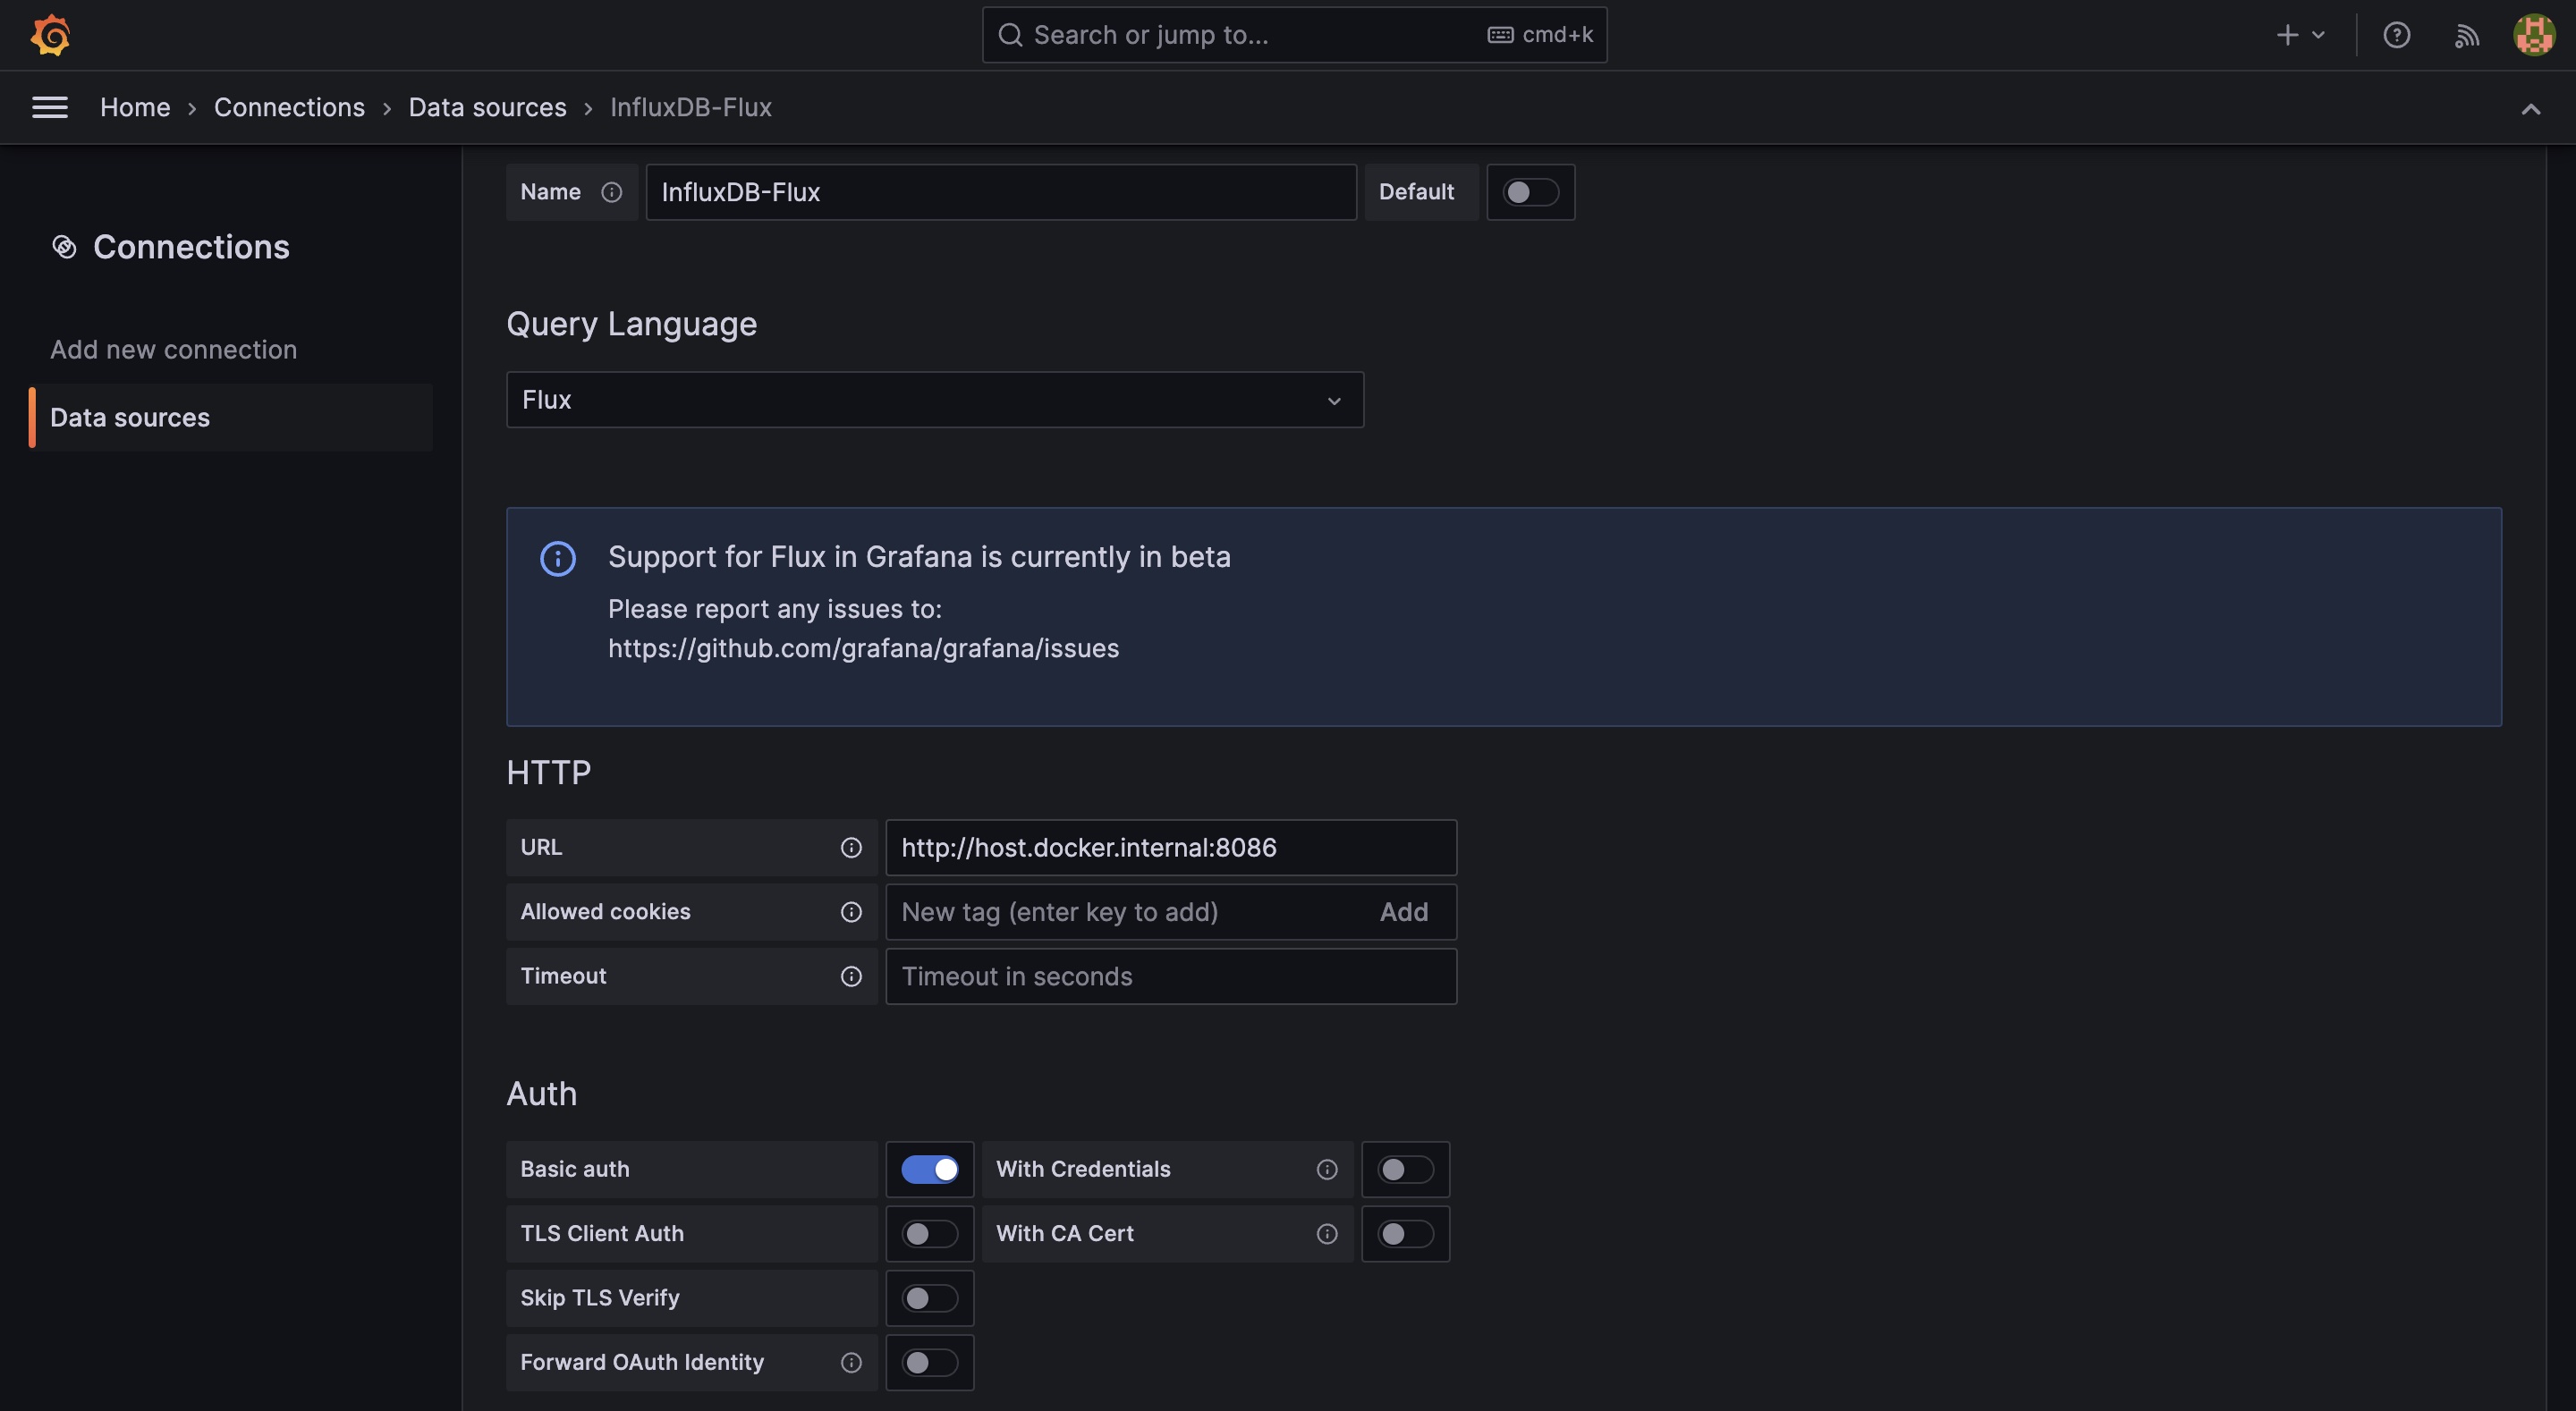
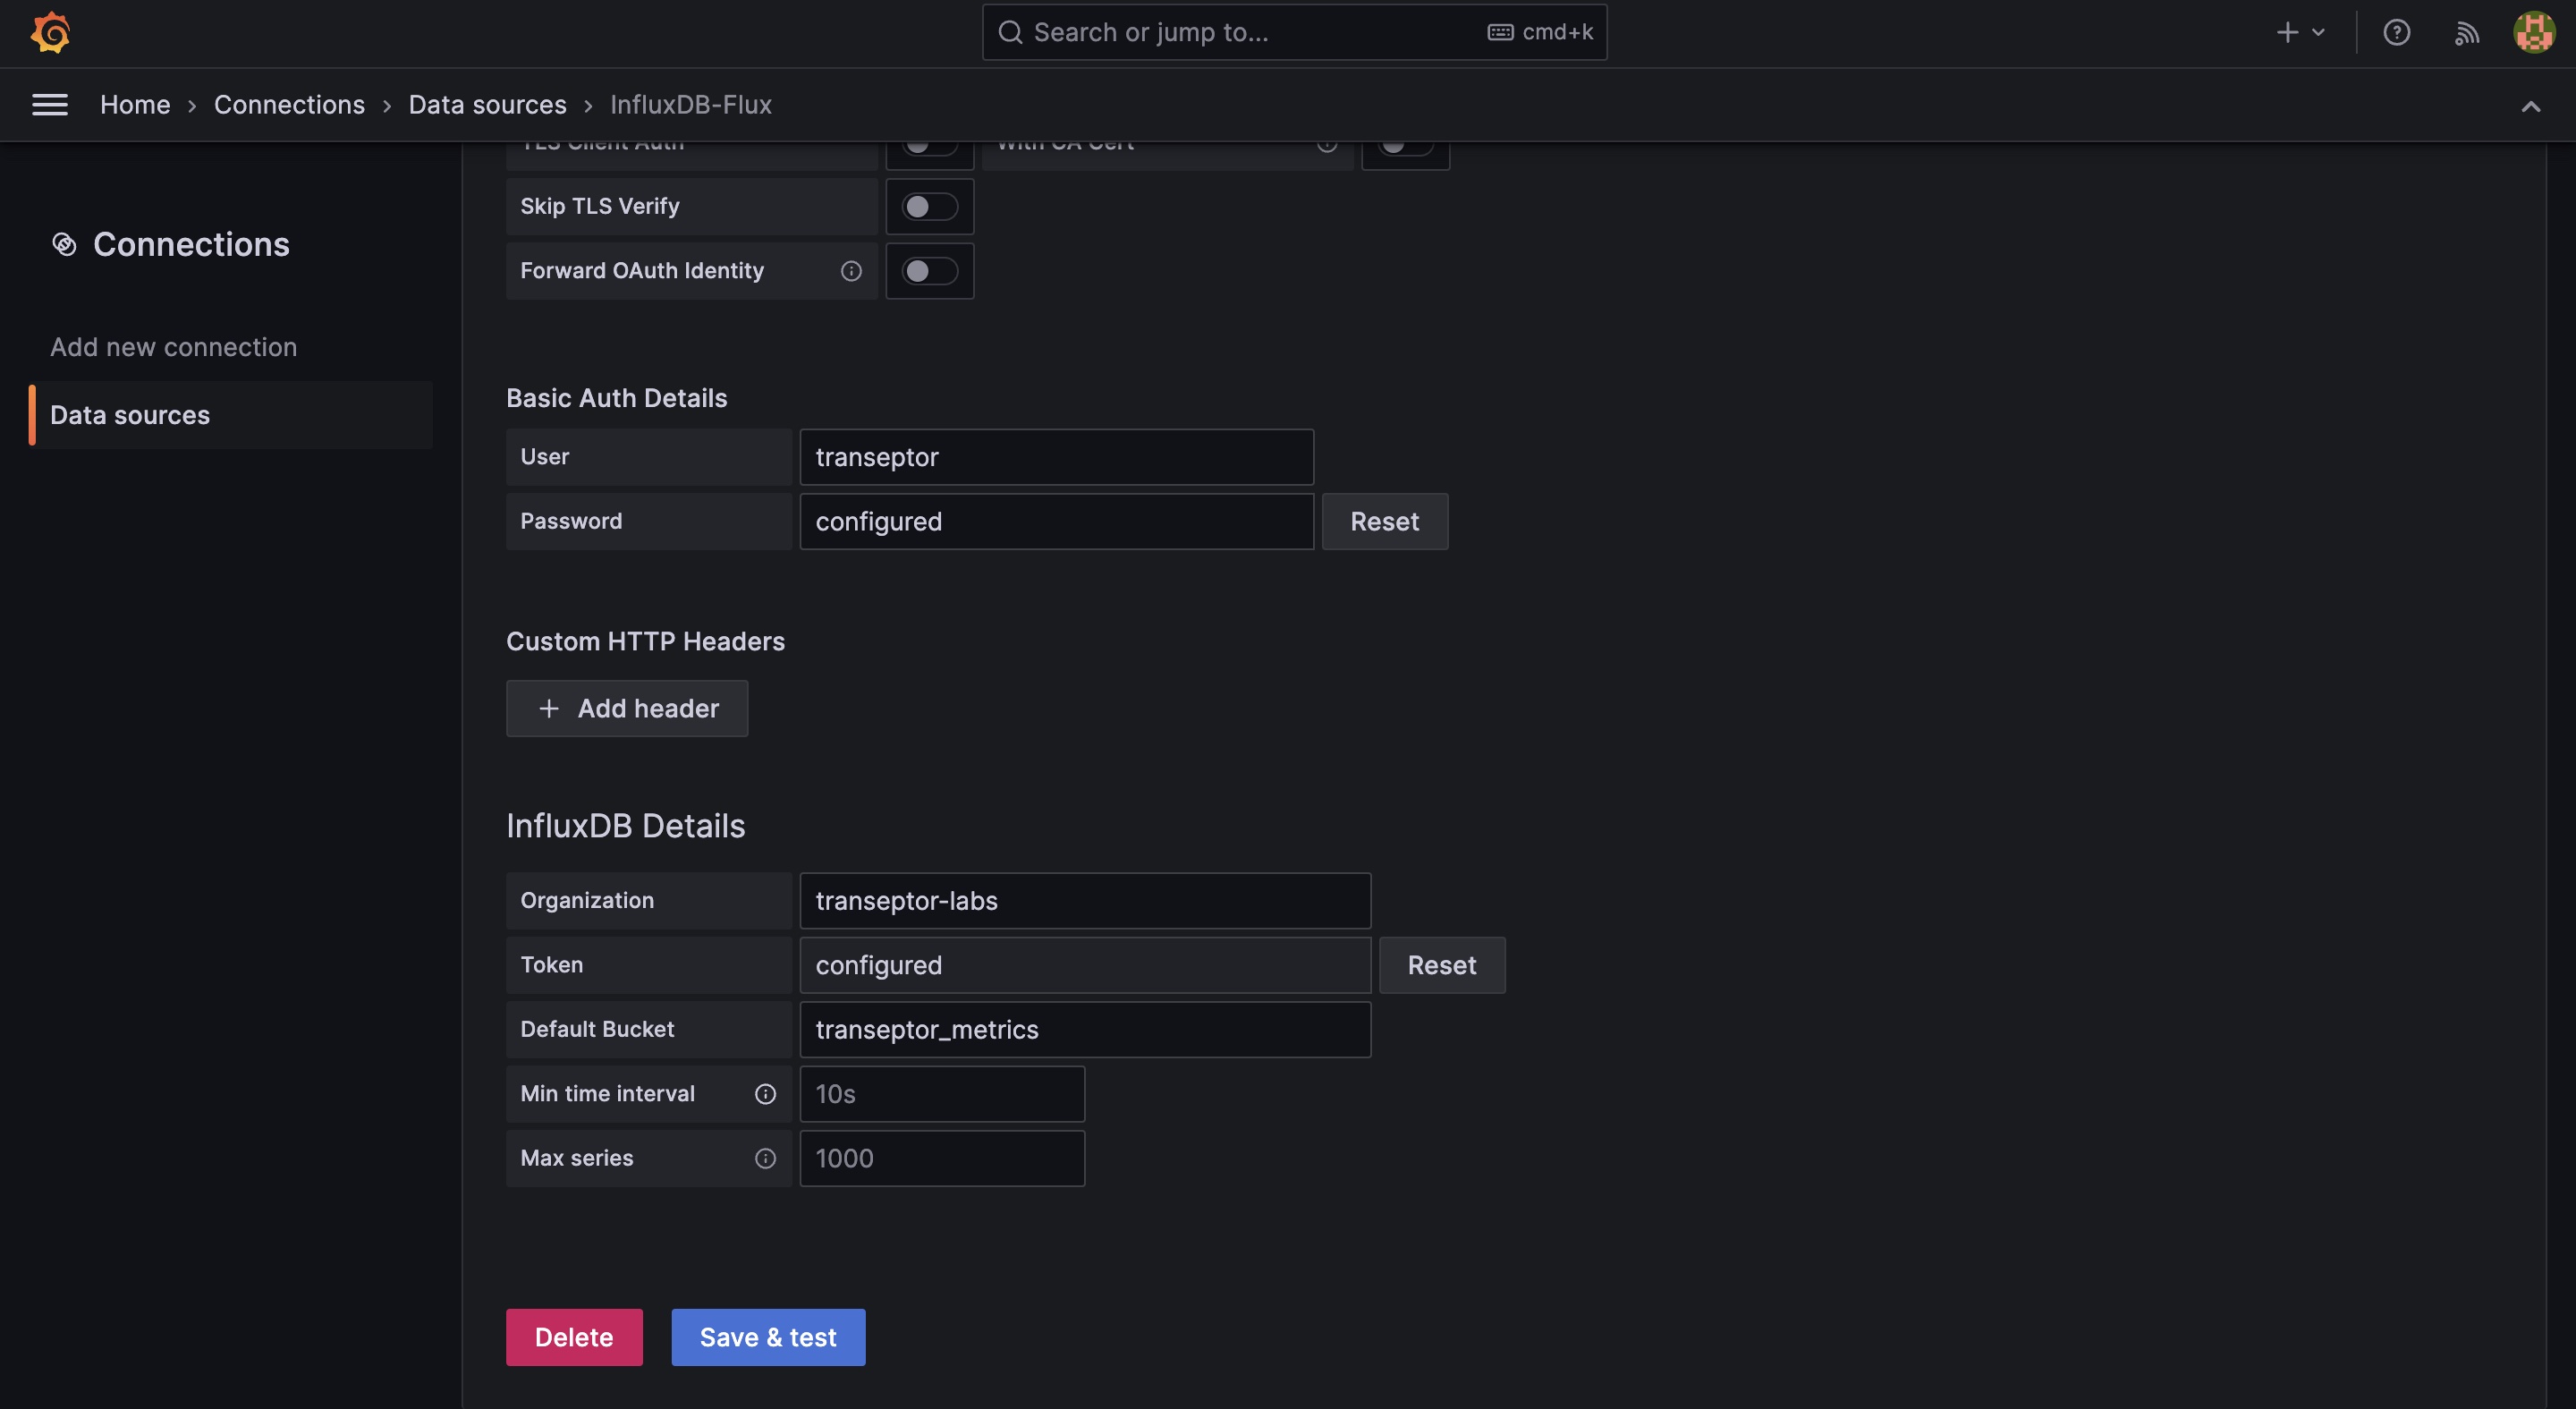
- Click
Save & Testto save the data source and test the connection.
If the connection succeeds, you should see a green Data source is working message.